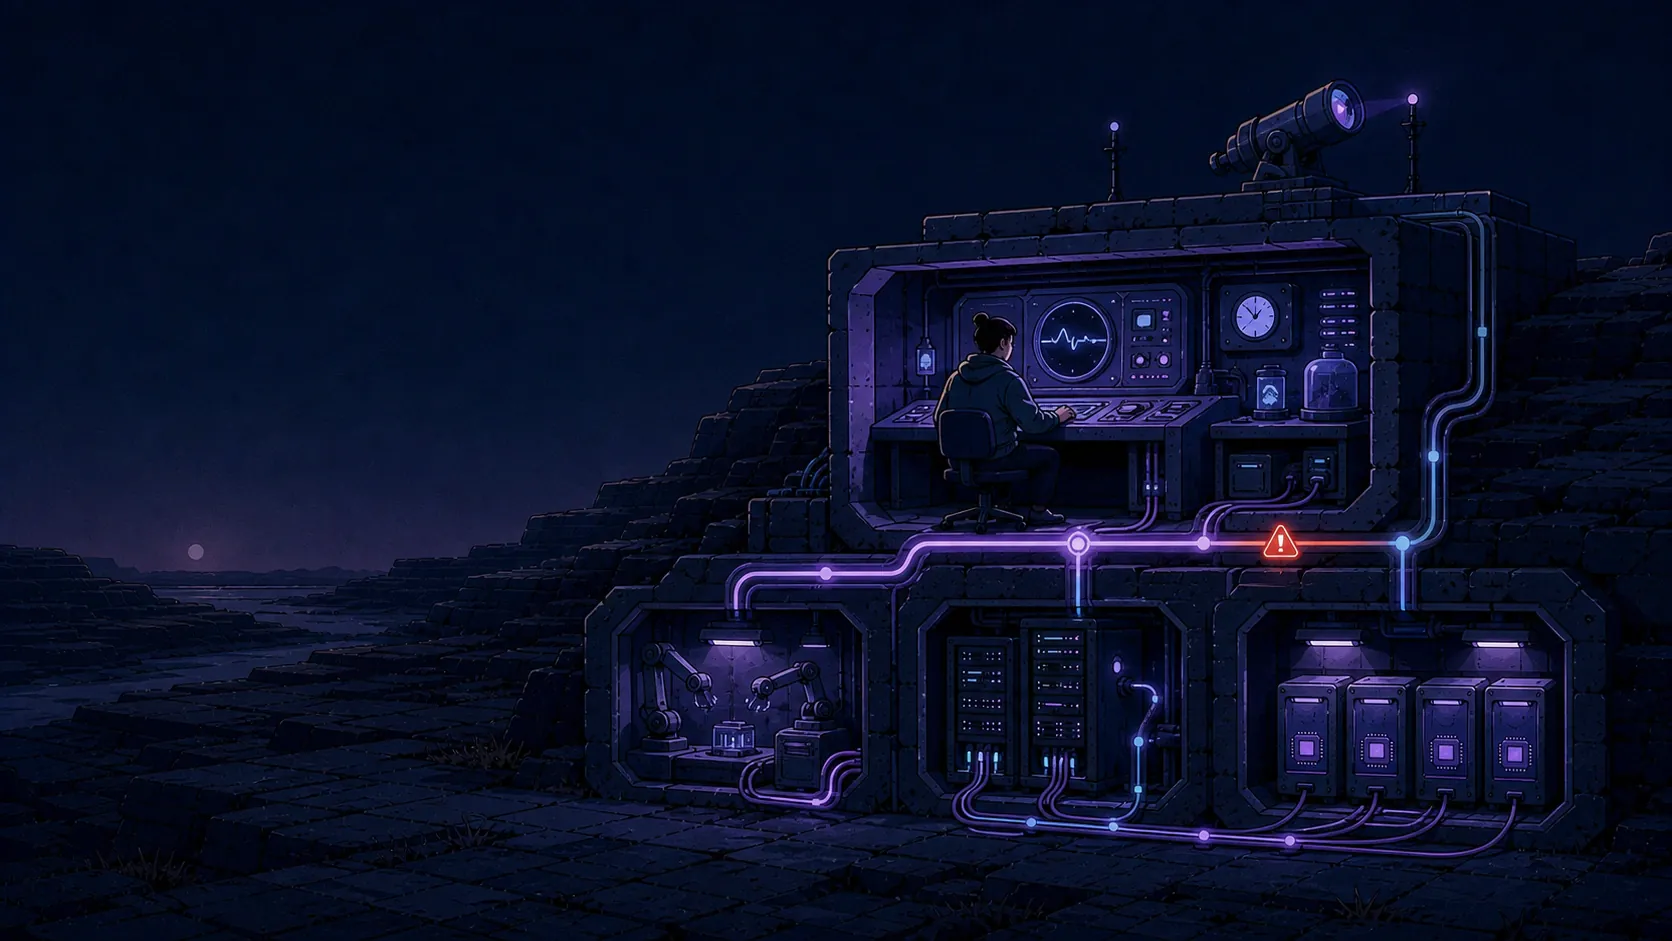
OpenTelemetry-native operations
See the request, the agent, and every expensive decision between them.
Correlate model routing, tool calls, sandboxes, approvals, evaluations, latency, tokens, and cost through one OpenTelemetry-native operating view.
One-time starter credit per account on Everstack Cloud. Expires 30 days after signup.
- 01Distributed traces
- 02Structured logs
- 03Operational metrics
- 04Cost attribution
01Operating model
One path from application intent to controlled execution.
Correlate model routing, tool calls, sandboxes, approvals, evaluations, latency, tokens, and cost through one OpenTelemetry-native operating view.
01
Trace the full AI lifecycle
Follow gateway middleware, provider calls, streaming, agent turns, tool execution, approvals, sandboxes, and evaluation results as one correlated trace.
02
Debug the decision, not only the request
Inspect which provider was selected, whether a cache hit, when fallback activated, and where time or tokens were spent.
03
Keep your telemetry pipeline
Use the embedded collection path or export OTLP into the OpenTelemetry infrastructure your team already operates.
02Capabilities
The controls needed to run it in production.
Everstack keeps observability connected to the same identity, policy, deployment, and telemetry boundaries as the rest of the platform.
Trace explorer
Search and inspect span trees for gateway requests, agent sessions, workflow runs, and evaluations.
Structured logs
Query logs across services and correlate entries through shared trace and span identifiers.
Operational metrics
Track volume, latency percentiles, errors, tokens, and cost across models, providers, projects, and agents.
Configurable granularity
Choose minimal, standard, or detailed tracing based on the evidence and storage profile you need.
Fallback visibility
See when routing changed providers and how that choice affected latency, errors, and spend.
Evaluation links
Jump from a failed quality score to the exact request or agent trace that produced it.
03Where it fits
Built for real workloads, not isolated demos.
Start with the narrowest useful surface, then connect more of the platform as the workload needs stronger execution, policy, or evidence.
Production debugging
Find the span, provider, tool, or sandbox operation behind a failure.
Cost control
Attribute tokens and spend to the workload that created them.
SLOs and capacity
Track latency, errors, and traffic patterns before customers report them.
04Questions
What teams usually ask first.
A direct view of how this surface behaves, where it runs, and how it connects to the rest of Everstack.
Does Everstack require a separate collector?
No. Everstack can collect telemetry directly, or export through OTLP when your deployment already uses an OpenTelemetry Collector.
Can I trace an entire agent turn?
Yes. Model calls, tool calls, approval events, and sandbox lifecycle operations nest under the session and turn spans.
Can traces show token cost?
Yes. Provider spans carry token and cost attributes so request economics remain connected to operational behavior.
Reference
The pages you open once you start building.
Continue through the stack